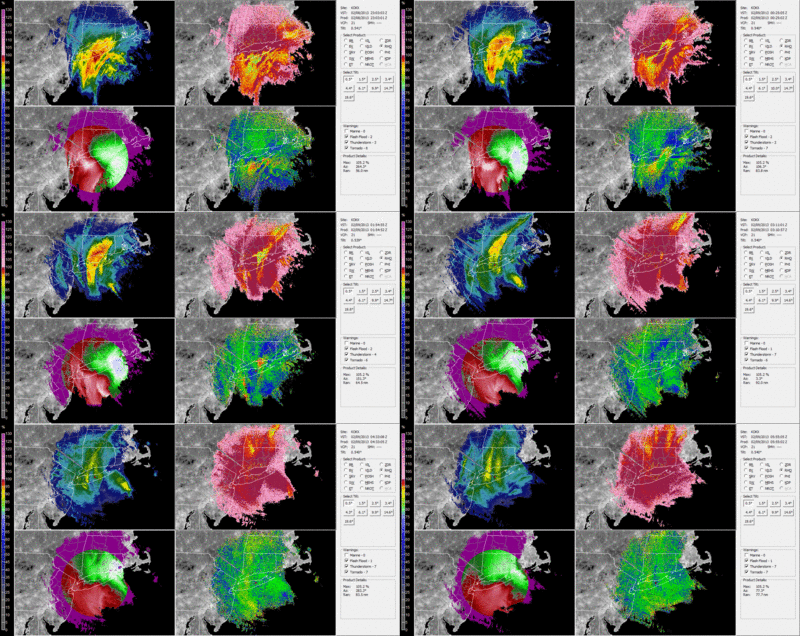
Anyone who looked at radar animation of this past weekend's nor'easter would have quickly noticed an intense precipitation band that stretched from Long Island northward into Connecticut. This band, at times, had dBZ values that were higher than 55 dBZ, and predominantly produced snow. (There are some reports that in southern Connecticut sleet or maybe small hail were also reported.) Beneath this band snowfall accumulations were upwards of 6" per hour!
For those who did not witness this band in person, I have put together an animated gif depicting the evolution of this band. The animation begins near 23 UTC on 08 Feburary 2013 and ends 06 UTC on 09 Feburary 2013. The four panels are:
- Upper Left: Lowest Tilt Base Reflectivity
- Upper Right: Lowest Tilt Correlation Coefficient
- Lower Left: Lowest Tilt Base Velocity
- Lower Right: Lowest Tilt ZDR
You may recognize the background. It's the black and white version of the GRx Population Backgrounds, which were announced in this post.
For a larger image animation, click on the image above to get the full resolution. Warning, it's about a 22MB animation!
