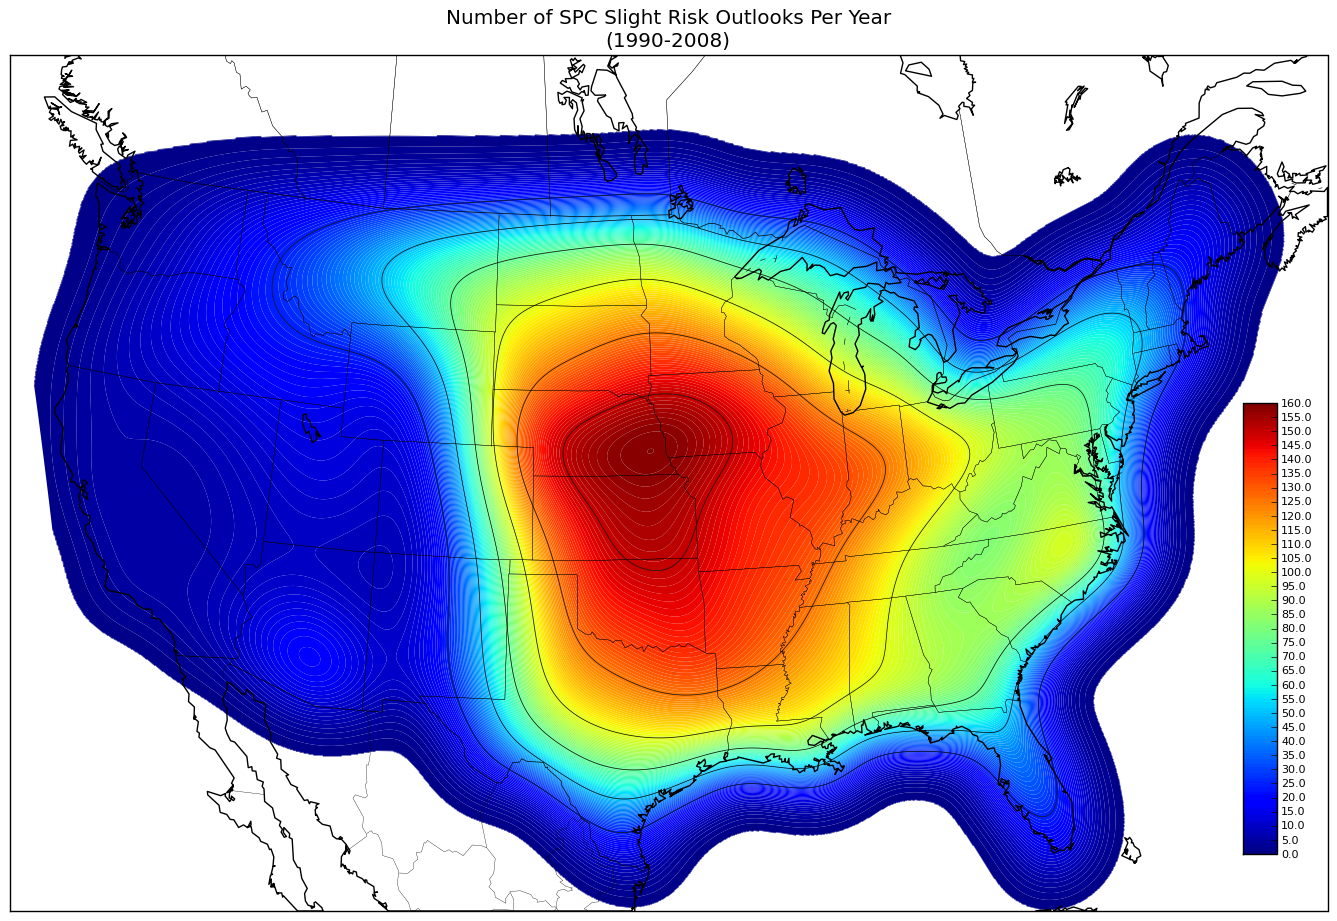
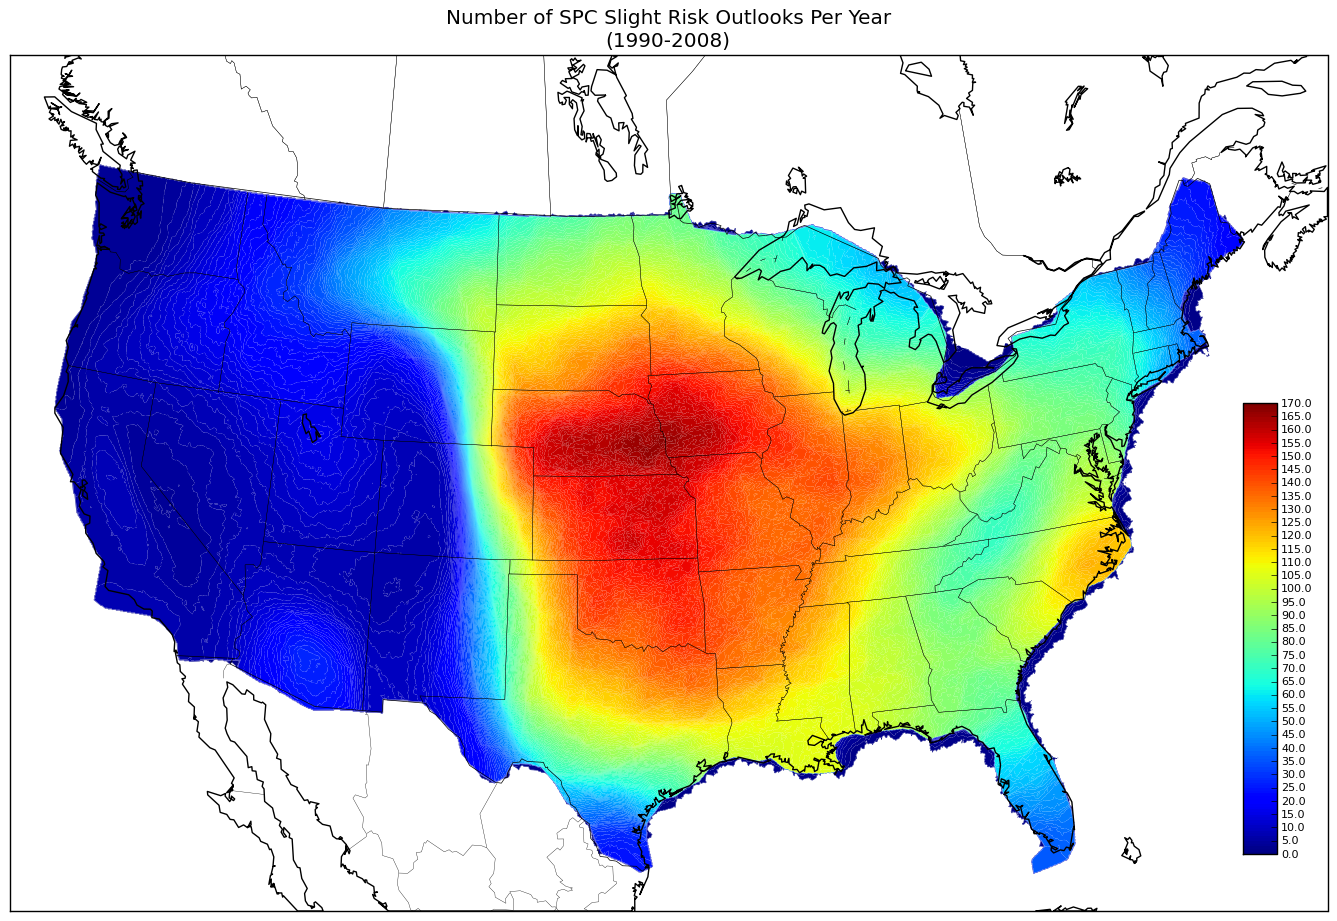
Next up in the list of Storm Prediction Center (SPC) outlook climatologies is the yearly climatology of slight risks. Between 1990 and 2008 there were 24,455 slight risk polygons issued. This does not mean there were 24,455 slight risk outlooks issued as it is possible to have more than one slight risk polygon drawn on a given outlook. Furthermore, note that each day consists of multiple outlooks and so it is possible for a grid point to receive multiple “hits” for being located in a slight risk outlook on the same day. In other words, if a location was located within 2 slight risk outlooks, this does not guarantee that two days of slight risks. The location might simply be contained within a slight risk from two separate outlooks issued for the same day.
Below is the slight risk climatology that employs the Kernel Density Estimation technique. Notice how it is smoother along the edges than the raw outlook which is located at the end of this post. The black solid lines are contour intervals of outlooks per year in steps of 25. The color fill contours are in increments of 1 outlook per year. As you can see, the central United States is once again the leader in the number of slight risks to expect per year. This has to do with the repeatability and predictability of the ingredients necessary for severe thunderstorm development. In other words, ingredients come together more frequently and more reliability across “Tornado Alley” than anywhere else in the world. This doesn’t mean that other areas aren’t prone to severe thunderstorms. Some of the largest tornado outbreaks in history have actually occurred well east of traditional Tornado Alley (e.g., 21 January 1999 and 3-4 April 1974).
Below is the raw graphic, with now Kernel Density Estimation applied. Because the edges are not smooth line, rather they are intersections from thousands of polygons, I did not plot any black line contours.

