After a long hiatus from blogging for most of February, I’m back at it as things appear to be slowing down just enough to let me have coherent thoughts again. This is fortunate since we’ve entered a new month and I need to post the March tornado graphics! This post should do the trick!
March Averages (based on data from 1950 – 2009)
60.63 tornadoes (3638 total)
186.1 injuries (11166 total)
12.93 fatalities (776 total)
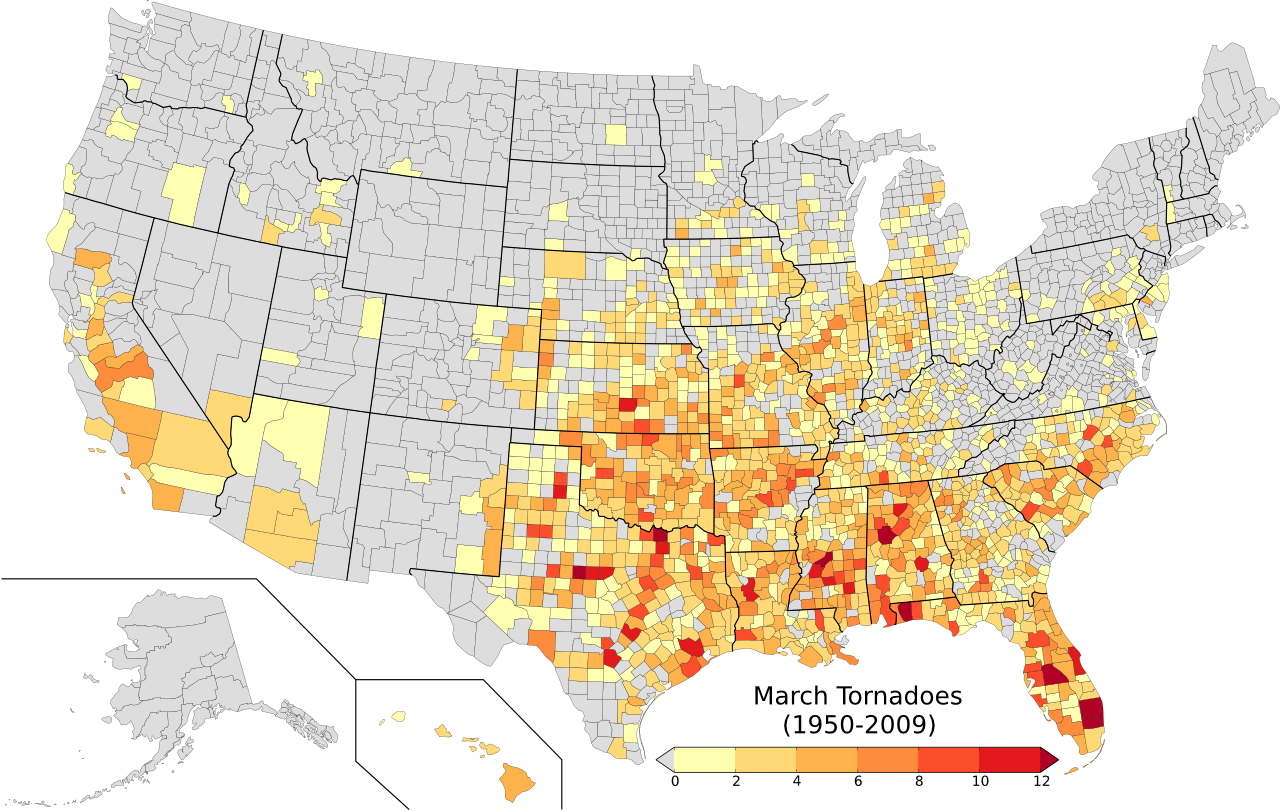
Above is a choropleth map of tornadoes by county. As we head into spring, warmer temperatures and more moisture begins making its way farther north and west than January and February. This allows for surface-based thunderstorms to develop farther north and west, and consequently we see a considerable expansion north and westward in the number of tornadoes. However, numerous tornadoes have been reported in the central valley of California.
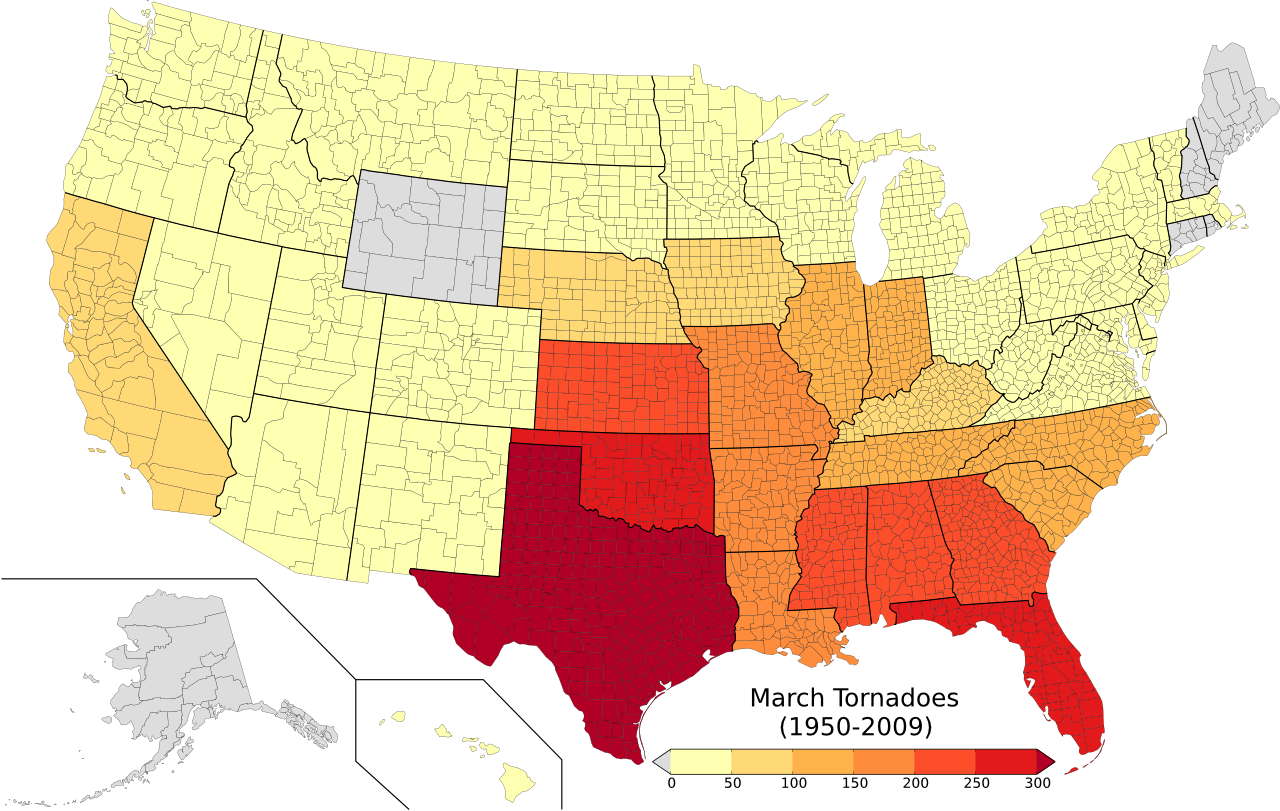
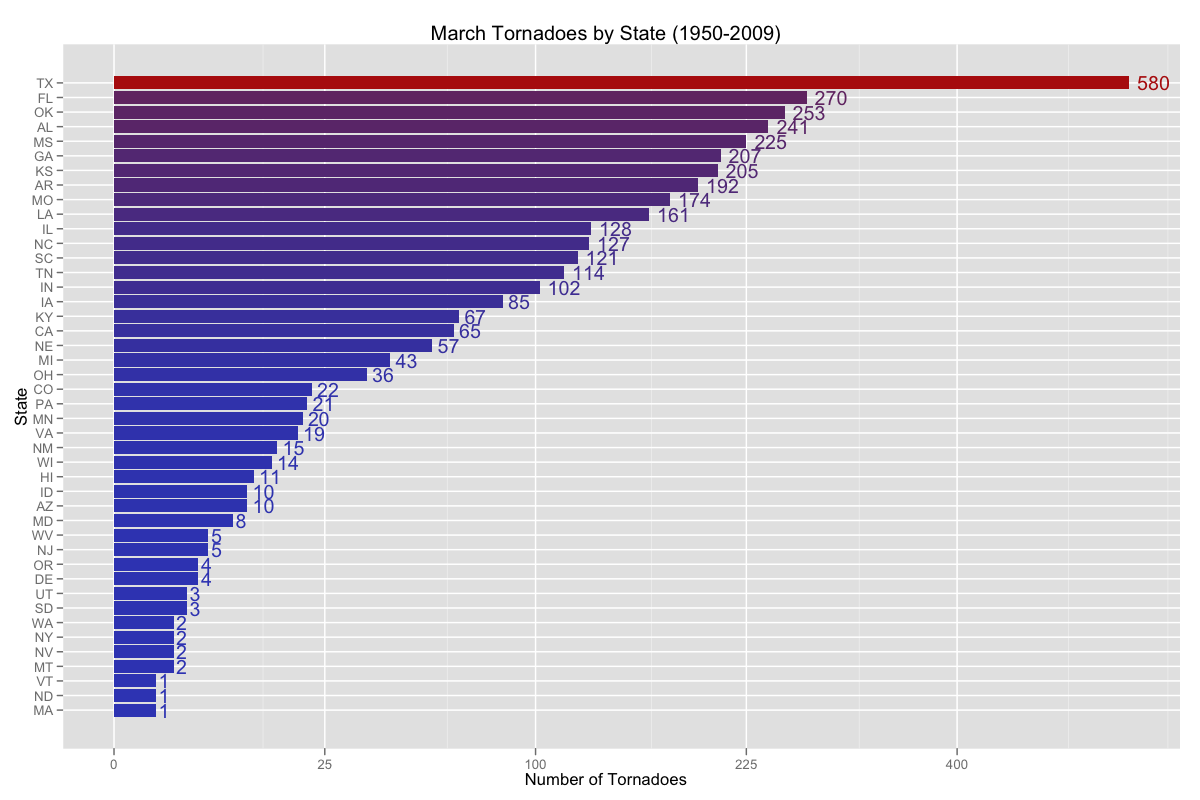
If we break the tornado numbers down by state, we can see that Texas is the big winner (or loser depending on your point of view), with the other southern plains states having high numbers of tornadoes. The southeastern states have little change with the February numbers, making this area one favored area for tornado development.
The actual counts by state are broken down below.
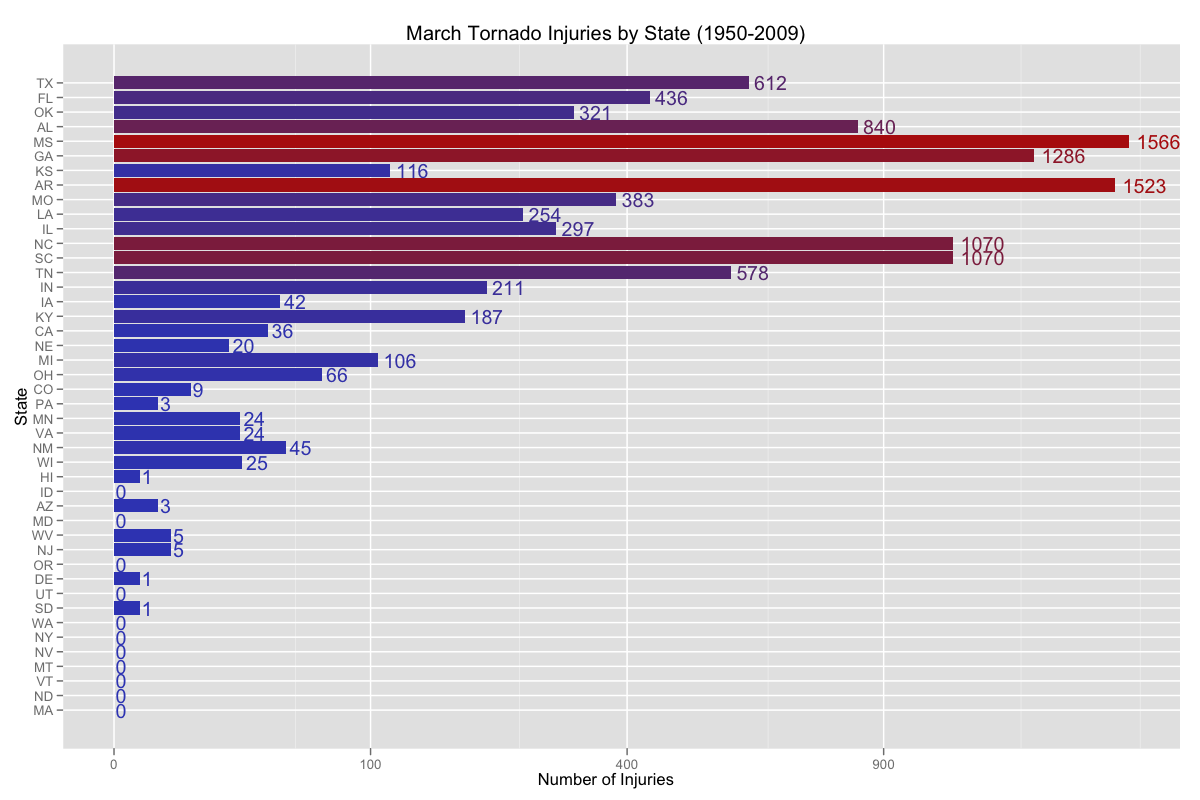
What about injuries? Keeping the same state ordering above (namely, in decreasing order of tornadoes), we can see the breakdown of injuries by state. For the third month in a row, Mississippi leads the nation in injuries, with Arkansas not far behind.
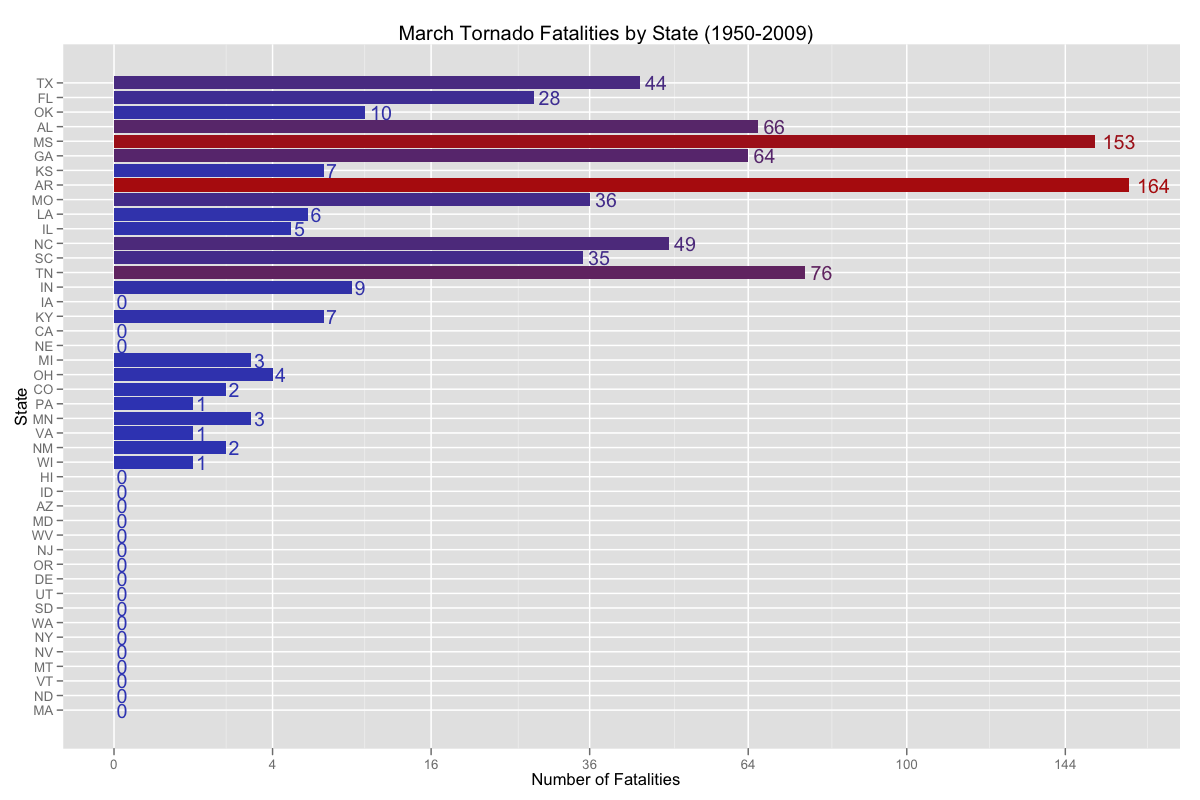
Examining the number of fatalities, Mississippi no longer leads the nation. Arkansas has the most number of March tornado fatalities, thanks in part to the 1 March 1997 tornado outbreak.
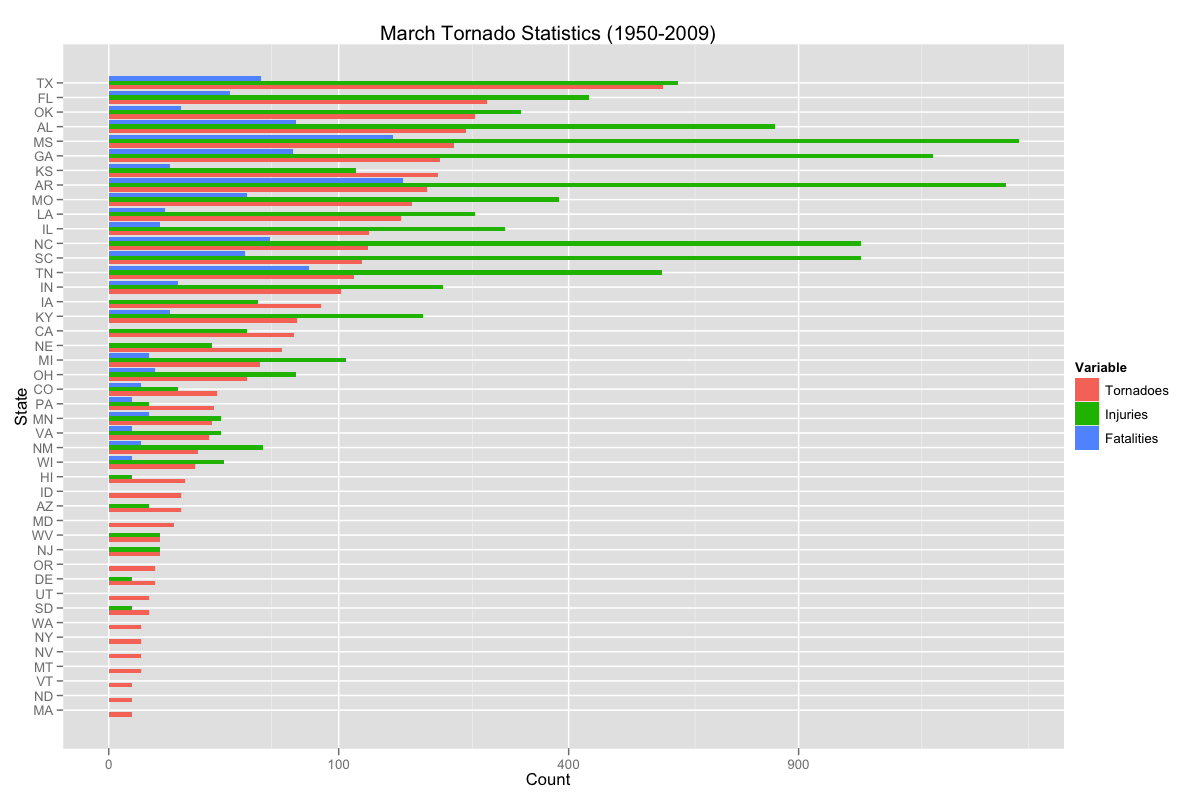
Lastly, here is a summary figure combining the last three figures.
